
Concealed families
What is this data about?
The 2011 Census gives us a mass of information about who lives where, and in what family groups.
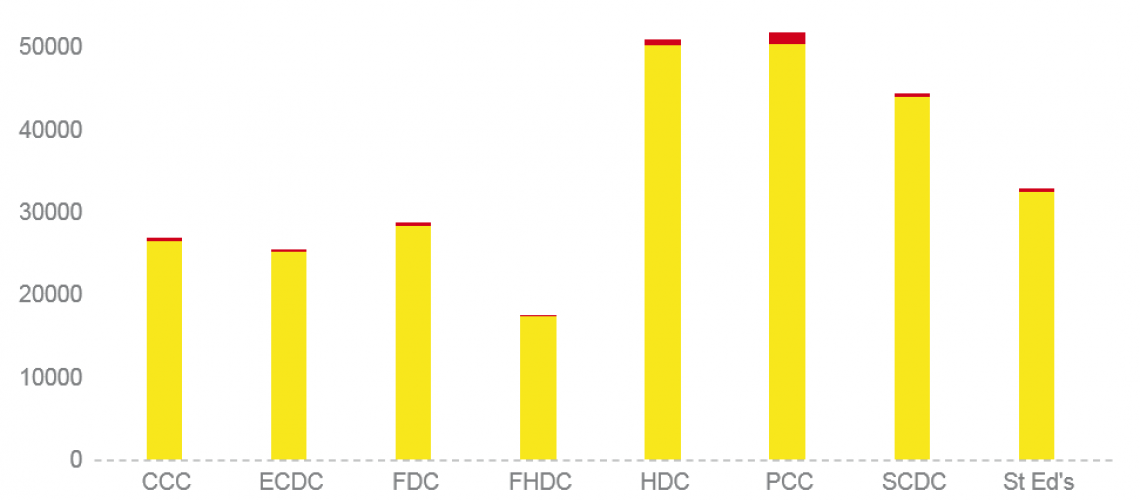
The graph above shows the total number of families in each district (in yellow) and the number of families who were 'concealed' based on 2011 Census data.
Where more than one family lives in a property, the “second” family is called concealed – for example a young couple living with parents, or an older couple living in their son or daughter’s family home. Using the Census, each family is assigned a Family Reference Person (FRP). Where there is more than one family reference person in the household, the primary family is identified (usually the one containing the oldest full-time worker). Other families living in the same property are then counted identified as “concealed”. ONS analyses concealed family types for each district in England. This is the data we have used, with a little editing, to make sure it is on "open" format.
Overcrowding is a different housing issue, where more people live in a property than is considered healthy. However it’s not the same as concealment because there is not a separate family group involved. With overcrowding, it’s just that there are too many people for the rooms available. If there are too many people because more than one family if living in the property, it then counts as a concealed family and will be counted in the concealed numbers here.
How much of an issue is it in our area?
The Census highlights only a small proportion of families, living in a state of concealment. While it's only a small percentage of each local district's families, it's still an issue for the families involved and needs to be considered as part of our assessment of local housing need. The image at teh start of this story shows the percentage of families in each district living in concealment. You can see a slice of the England-wide data here:
You can see some local data, organised by age band of the family reference person for concealed households in eight local districts. You can use the legend and the control buttons to see specific age groups, and/or to make the chart stacked or unstacked...
Link to ONS infographic
Questions?
If you tweet about this story, please tag @CambsInsight as we’d love to see how the data is used.