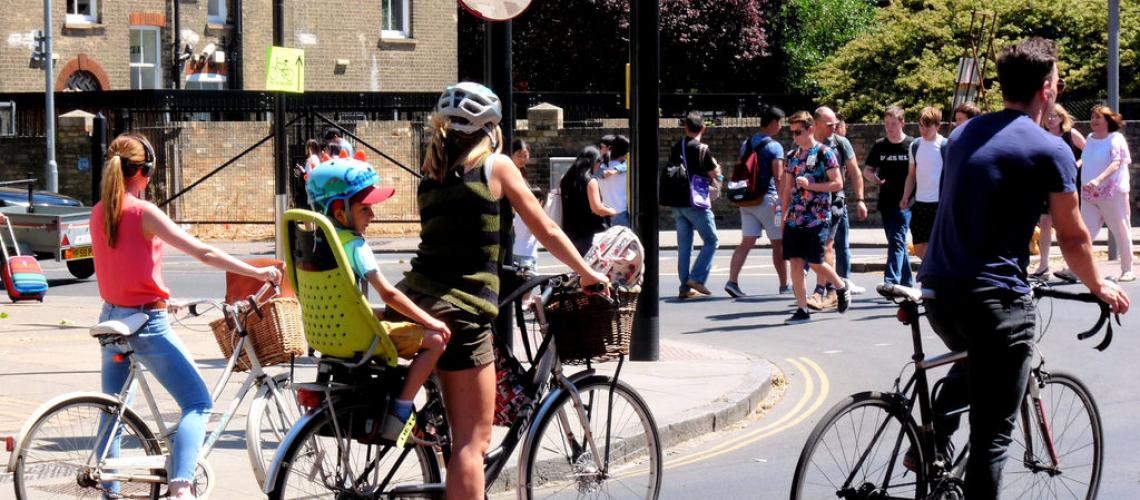
Cycling Counts: Tracking the figures in 2018

Our recent data story on developing the cycle monitoring network across Cambridgeshire highlighted the rich levels of data currently available and our desire to renew the structure of cycle data monitoring locally.
Whilst there were visible gaps in the county wide open data offer, the release showed that some sites were data rich and this datastory will look to provide some further insight into more detailed counts on two of those sites; Impington North Busway and Newtown South Busway over the course of a year (2018).
The datastory will include analysis of the numbers of cyclists passing through these locations each week over a year, each day over the course of June and by hour over the course of an average day in June.
First things first, where are we talking about? The two cycle counters referred two throughout this datastory are shown on the below map:
The first piece of data shown below displays the 24 hour average count of cyclists for each week in 2018 across both locations.
The chart below shows two different pictures for the two locations. In the first at Impington we see what you might expect- a slow rise during the first few months of the year before a sharp rise in April before continuing to rise to a peak into early summer to mid summer. This was followed by a reduction in numbers over the school summer holiday before a short sharp rise as people and children maybe go back to work and then a more consistent reduction as the days become shorter and the weather worsens into winter.
At the Newtown South Busway site, the rise and fall is less pronounced over the year with a generally more consistent volume of cyclists. The first few months into early spring are largely consistent, this is followed by a sharp rise in April as with Impington but then a more consistent picture emerges over the remainder of the year despite the peaks and troughs. Newtown South sees large numbers of cyclists per week right through to the latter stages of December before dropping off at Christmas. This is in contrast to a more defined reduction from November in Impington.
The next set of sample data assesses the daily variations over a month. We have chosen a week in June 2018 for this sample because we have reliable data over the period and it is a month of higher cycle counts across the network as a whole.
The graph below shows the daily count of cyclists passing through both cycle counters each day. The pattern shows clearly that cycle usage is high during the week and lower on the weekends highlighting that a large amount of of cyclists are likely be commuters heading in and out of the city. The line graph below for Newtown South Busway shows a very similar pattern of cycle activity throughout the month of June with the highest numbers of cyclists counted during the week with a significant drop off over the weekend but still maintaining a consisent level each weekend. This again highlights a picture of cyclists that are consistently using their bikes throughout the working week and despite lower numbers also using them during the weekend to head in and out of the city.
The next set of charts highlight the average hourly count of cyclists recorded passing the cycle counter sites within the month of June 2018. To do this each hourly count for every day was added together and divided by the number of days to produce a mean average count for each hour of the day.
Based on the daily counts above the below graphs have been split between average hourly counts for weekdays and weekends due to the significantly differing cycle counts between weekdays and weekends.
The next two graphs group Impington North and Newtown South together and highlight how cycling habits differ during the week and the weekend. The first graph shows weekday volume at both sites.
There is a clear pattern of peak times both in the morning rush (between 8AM and 9AM) and the evening rush between (4PM and 6PM) with a levelling off in between and steep reductions either side of the peak. This confirms that the majority of cyclists are still cycling in and out of the city during the common commuter window we would expect. However, the morning peak is more pronounced than the evening suggesting that despite the commonality of flexible working most people are still getting to work or education before 9AM.
The evening peak though is slightly less pronounced, perhaps because of different finishing times for the employed, afterwork activities, the likelihood that student commuters may be finish earlier in the day and the need for many parents to finish early because of child-care.
The chart below shows how the pattern of cycle use during the weekend is markedly different from weekday use across both Impington and Newtown cycle counter sites relative to the graph above.
The graph shows what we might expect on a weekend - a slow, sleepy upward trend of cyclists moving past the counter sites until midday, at which point the volume of cyclists plateaus until around 5PM when the volume of cyclists starts to reduce.
