
A quick look at the Mill Road Bridge Closure: Headline Traffic Counts

Our last data story discussed how 15 smart sensors have been installed on Mill Road and surrounding streets to record numbers of pedestrians, bicycles, cars and other vehicles. The data being collated and analysed by the Smart Cambridge programme will help the Greater Cambridge Partnership and the County Council understand how people use the road network.
The collected data has formed part of an open release via Cambridgeshire Insight Open Data.
The 15 smart sensors have now been up around Mill Road for over 2 months so we have decided to provide a quick overview of what has been happening to motor vehicles, cyclists and pedestrians in the time before (data covering 03/06/2019 to 30/06/2019) and during (data covering 01/07/2019 and 04/08/2019) the bridge closure.
A map of the locations referred to in the story can be seen below.
Motor Vehicles
The average daily motor vehicles recorded at Sensor 1 located at the east end of Mill Road was approximately 8,350 in the weeks leading up to the Mill Road bridge closure (03/06/2019 to 30/06/2019) and was around 12,500 at sensor 2 located towards the city centre. In the period of available data during the bridge closure (01/07/2018 and 04/08/2019) this has dropped significantly, as expected, to just under 5,000 at sensor 1 and around 7,200 at sensor 2.
This is an average reduction of aproximately 41% in recorded motor vehicles across the 2 Mill Road sensor locations.
The challenge though comes in understanding the impact of these decreases and where the impact of displacement hits across the rest of the network.
Chart 1: Daily count of motor vehicles at Sensor 1 (S1) and Sensor 2 (S2) between 03/06/2019 and 04/08/2019

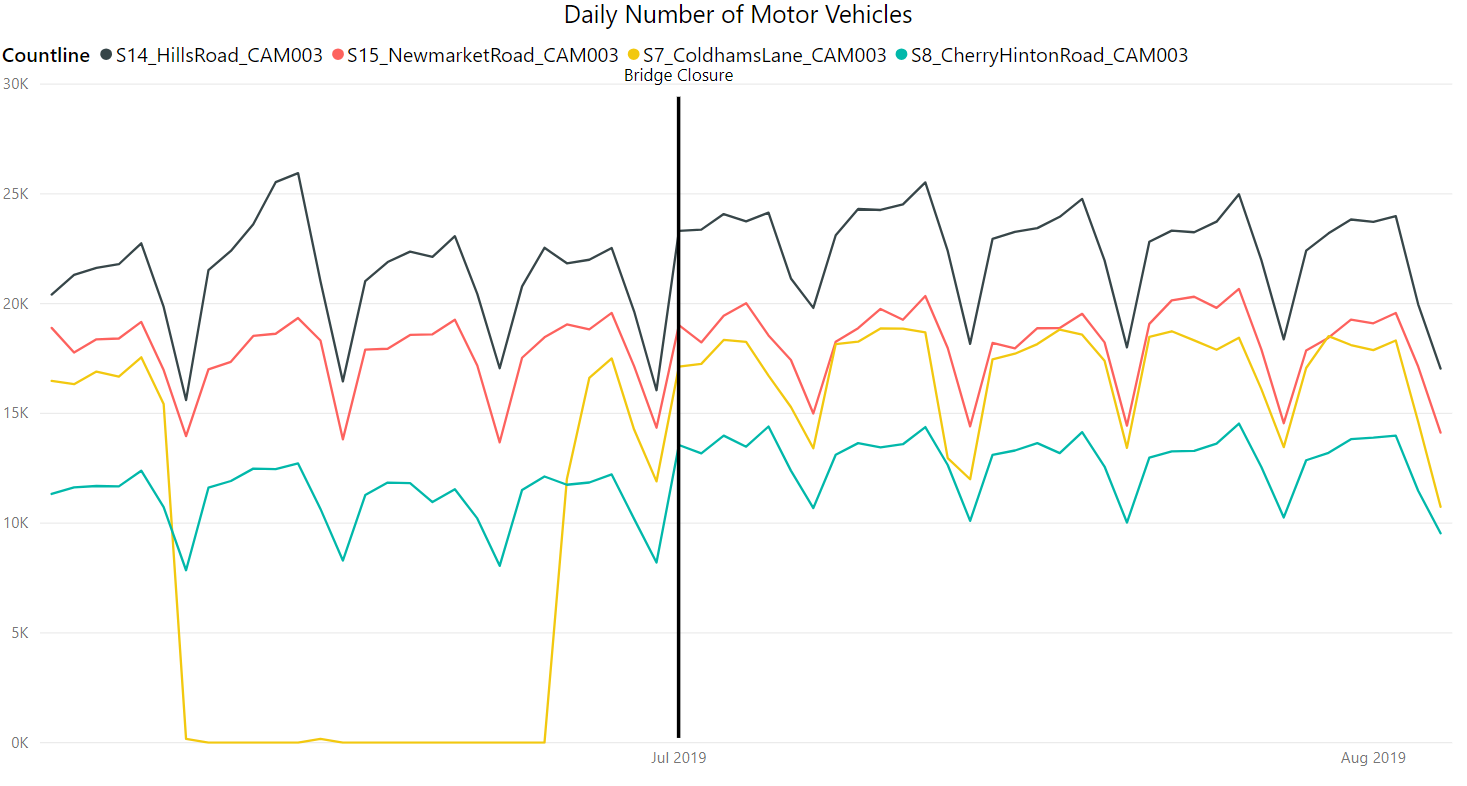
There was a noted increase in motor vehicles across 4 of the main alternative diversion routes being monitored around Mill Road since the bridge closure took place. Cherry Hinton Road has seen the highest increase of 14%, followed by Hills Road with a 7% increase. Newmarket Road and Coldham’s Lane sensors have seen less significant increases of 4% and 2% respectively.
Data from the 9th to the 25th June has not been included in the calculations for Coldham’s Lane due to lack of data in this time period. The installation of the sensors was not just about monitoring the changes in traffic, but also about trialling new technology, due to the technology in the existing permanent Automatic Traffic Counter network being outdated and unreliable. Therefore it is important to note the failure of the Coldham’s Lane sensor, although the performance of the sensors overall has been strong.
The daily average number of motor vehicles recorded across these 4 routes has increased by around 4,300, which more than accounts for the approximate 3,400 that have been displaced from the East end of Mill Road.
Chart 2: Daily count of motor vehicles at 4 key diversion routes from Mill Road: Hills Road (S14), Newmarket Road (S15), Coldham's Lane (S7) and Cherry Hinton Road (S8)
Cyclists
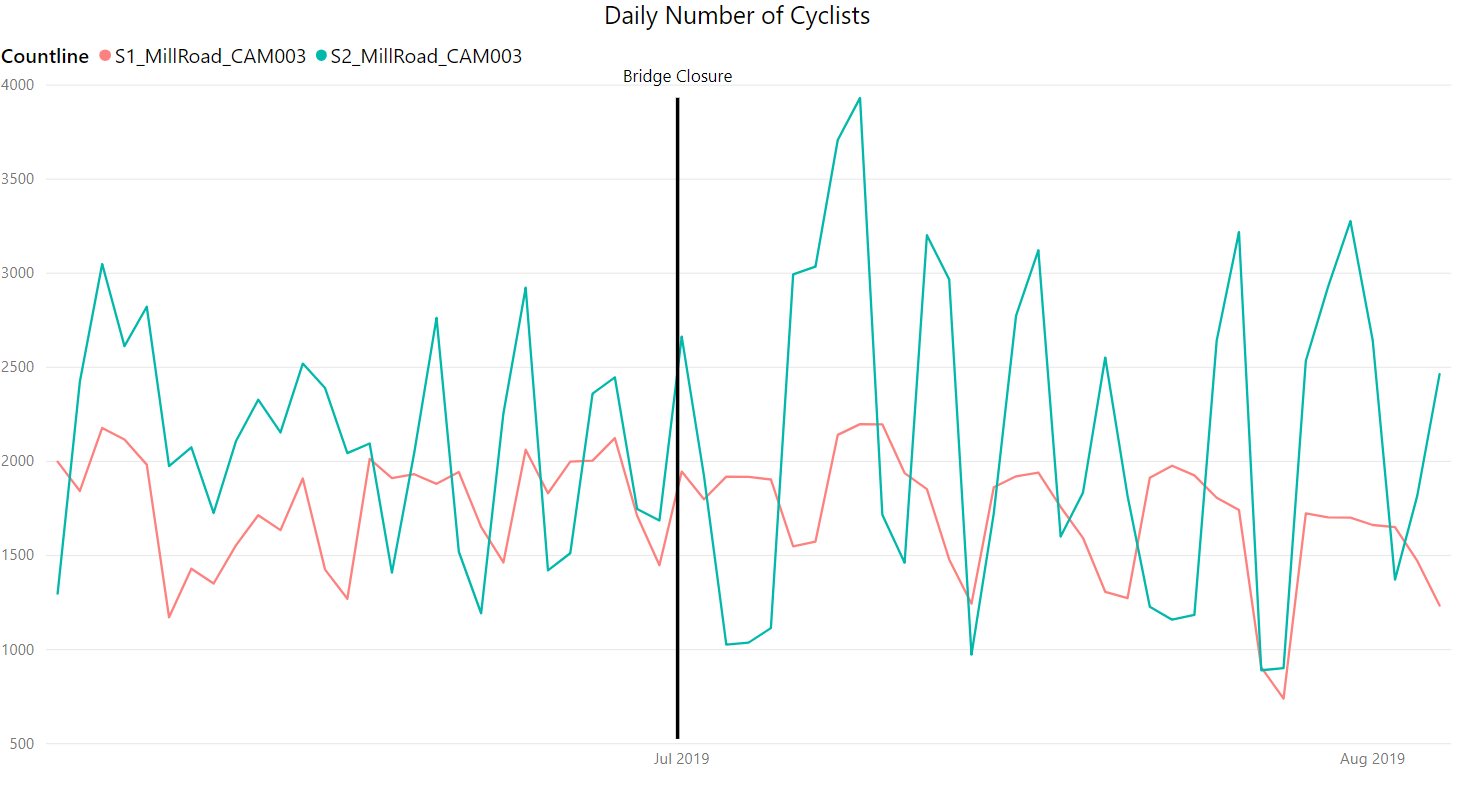
Daily cycle traffic has remained relatively flat at both ends of Mill Road pre and post bridge closure. This is unsurprising, given that cyclists have not been restricted from using the bridge.
Chart 3: Daily count of cyclists at Sensor 1 (S1) and Sensor 2 (S2) between 03/06/2019 and 04/08/2019
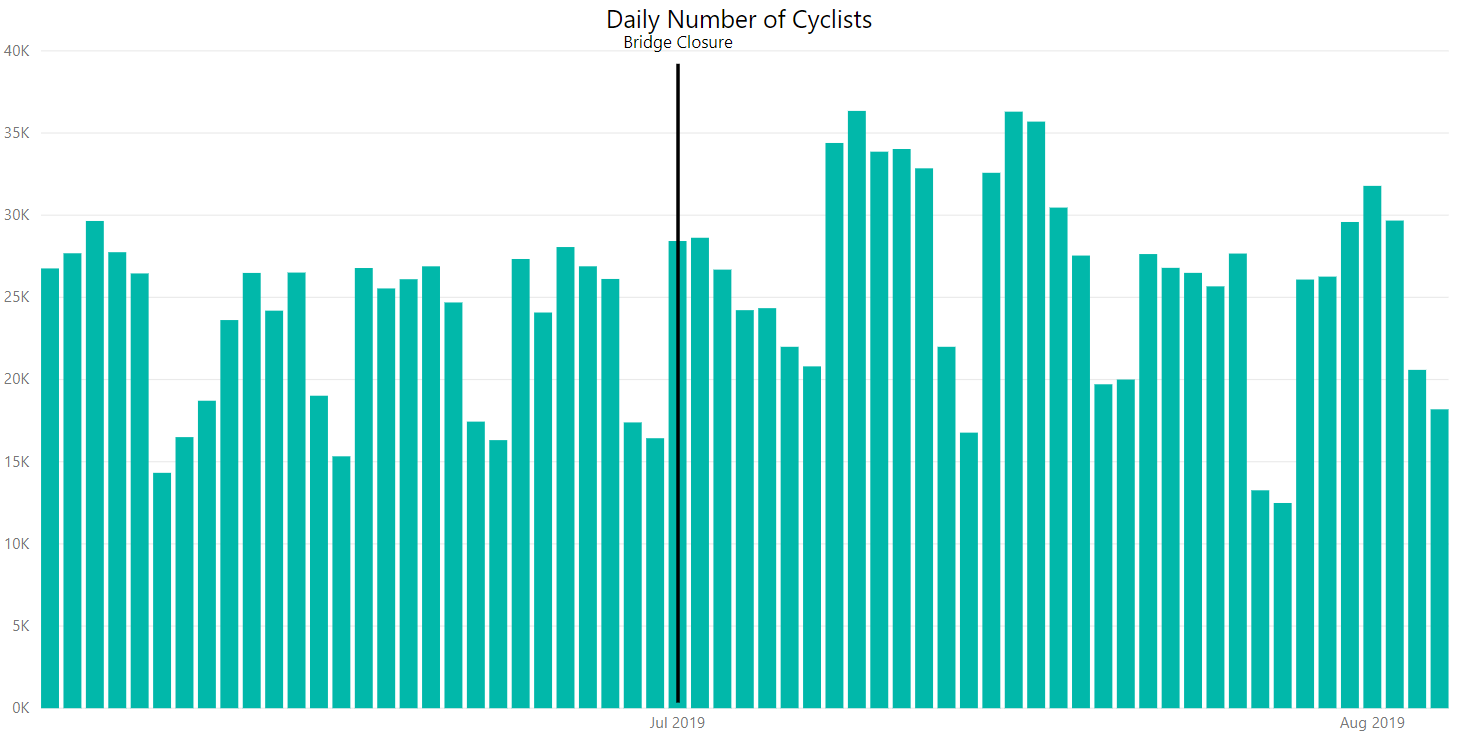
When looking at the total number of cyclists per day across all 15 sites being monitored, there has been a significant increase of 14% since the bridge was closed (01/07/2019 to 04/08/2019). This, however, could be down to a number of confounding factors such as the start of the school summer holidays and changes in weather and so we cannot say with certainty that is related to the bridge closure.
Pedestrians
Footfall has been varied across the 2 Mill Road sensor locations. Sensor 1 to the East has seen a decrease in pedestrians of 12% when looking at the daily average before and after the bridge closure. Sensor 2 near to the city centre however, has seen an increase in pedestrians of 8%.
You can also see a dip in the data around the time of the recent fire on Mill Road, which restricted access for a number of days.

Overall, we have seen that the vehicle reduction on Mill Road has been accounted for in an increase in traffic on other major routes into the city from the East. We have seen a significant increase in cyclists across the city generally and it will be interesting to see if this trend continues. The bridge closure seems to be having a positive effect on footfall at the city end of Mill Road, but a negative effect at the east end.
The sensors will continue to monitor traffic for approximately the next 18 months, with monthly data releases being added to the existing dataset.